Misleading Graphs Lesson Quiz
Type or select your answer, then press "Check".
After a correct answer, click the => to advance to the next question.
After a correct answer, click the => to advance to the next question.
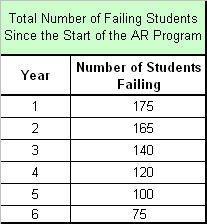
 The data on the right suggests that the AR program appears to be helping the students. A group of lazy students want to make a graph to help convince the PTA that AR is a waste of money. Which of the following would be the least flattering scale?
- 0 - 200
- 50 - 200
- 0 - 500
- 50 - 500
| © 2010 Norm Mitchell. All Rights Reserved | Legal | Privacy | COPPA | | Site Map | Search | Contact | Help |
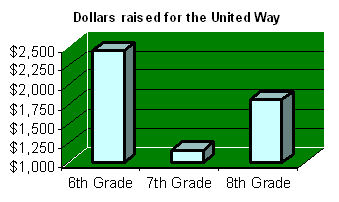
 What aspect of the graph was used to mislead the reader?
 What will the 7th grade need to do to make this graph more fair?
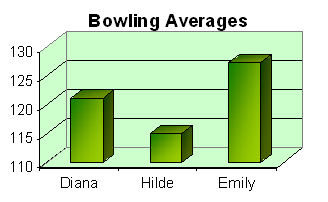
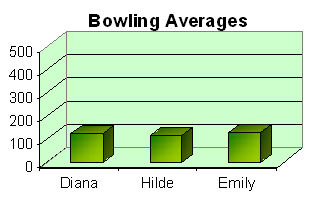
 Emily's bowling average is 12 points higher than Hilde's. For bowling, that is a lot. How has Hilde mislead you with her graph of the girl's averages?