Misleading Graphs Study Page
Use the menu below to learn, practice and master this skill.
|
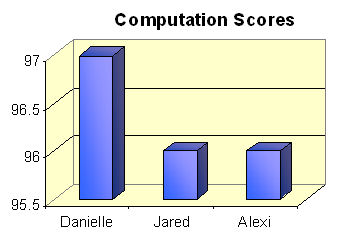
Misleading graphs can be a lot of fun! Today's **extension will show you how to adjust the y-axis values in Excel to create a variety of misleading graphs. |
Click this link to return to the Graphing Studies Page.
|
- Warm Ups - Get Started with a vocabulary matching practice and quick review.
- The Learning Center has Lessons, Guided Practices and easy practice activities to help you master every skill!
- The PowerPoint styled lessons show you how to do each skill.
- Guided Practices offer you a chance to solve a problem - then see the solution!
- Easy Practices are matching or other simple assignments to give you an opportunity to practice.
-
Why take a quiz or test in class without already knowing that you will pass?
- Try the practice quizzes and tests to help you know your areas of weakness - then improve!
- You can click "try again" and get a whole new test on each skill!
-
Why not get some "Extra Credit" for your efforts?
- You can have your practice results emailed to your home!
- Challenge your friends and see who suffers from the "called to the board quakes and shakes"!
- Click Here and you will be taken to the Score Reporting version of Math6.org!
| © 2010 Norm Mitchell. All Rights Reserved | Legal | Privacy | COPPA | | Site Map | Search | Contact | Help |